
Confocal microscopy multicolor experiments require understanding of fluorescence spectra and how each fluorophore you use needs to be set up in the microscope for the signal to show, appear in the right channel and with the correct color. Setting up your lasers is also a process you need to go through.
In this article I will describe everything you need to know, in simple to understand terms, to set up your microscope so that you are able to see your stainings properly.
Setting up a microscope for fluorescence properly consists of selecting a fluorophore based on your available light sources where the laser line should intersect your fluorophore excitation curve, adjusting your lasers, setting up a light path including beamsplitters and filters, adjusting your pinhole size, gain, output color and scan preferences to optimize and isolate signal and avoid overlap, spill and photobleaching.
Let’s first briefly discuss the basics of fluorescence, spectra and lasers.
Fluorescence
Microscopy requires high contrast for the best image which is provided by fluorescence and fluorescent dyes. These dyes, or labels, attach to proteins when you incubate your tissue in their solution for a period of time. This allows for high specificity for the target protein you are trying to visualize.
The black background of the image combined with a bright, colorful dye give the perfect image for visualization and measurement of signal. Brighter colors mean more protein is present. A weak signal would mean having to turn up gain which would result in more background signal that is not part of your staining.
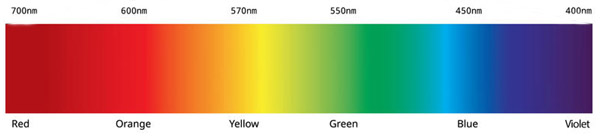
Fluorescence works based on the fact that when you illuminate a material (fluorophore) at a certain wavelength of light, the material will emit light at a different wavelength. This can be predicted.
Fluorophores
A fluorophore, sometimes called a fluorochrome, is simply a fluorescent compound that upon light excitation emits light. Other words for it used commonly are stains, fluorescent dyes, and labeling reagents.
Be careful when using fluorophores with green excitation spectra, as these are stronger and brighter than other colors. While this is good for seeing your stained object, it may require lowering the gain on that channel to prevent bleaching, as well as taking measures to prevent spillover into other color channels. In addition, as you increase wavelength, the autofluorescence decreases, which again makes a lower wavelength such as green fluorophore not the best choice.
Here is a useful table that gives the absorbance wavelength, emission wavelength, as well as color you will see in your microscope for common fluorophores.
Excitation and Emission Spectra
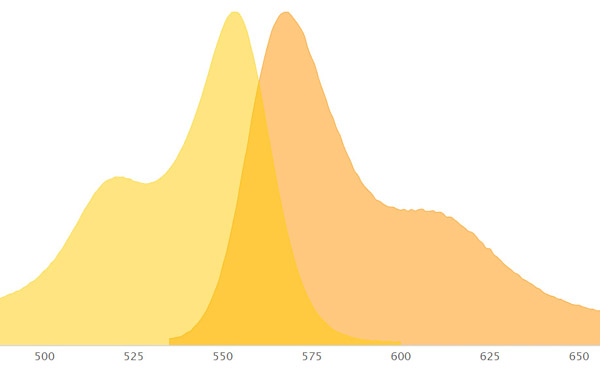
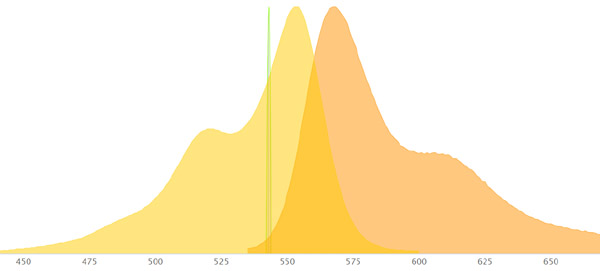
Excitation and emission spectra are characteristic of specific fluorophores. Fluorophores absorb light at a shorter wavelength and emit light at a longer wavelength (lower energy).
What you see is two curve graphs, one with a peak for excitation and one with a peak for emission. Some dyes have a short distance between the excitation and emission peak while others have a longer distance.
Filters inside the microscope control what range of wavelengths of light is passed through and what is blocked.
The microscope collects individual channels of light, usually Red, Green and Blue. These channels can be put together by software to form a multi colored image you are used to seeing.
Common Lasers and their wavelengths
Lasers are a type of light source in a microscope, especially in a confocal microscope where they combined with the pinholes provide a powerful controllable light. Each laser has a distinct wavelength.
Below are some common lasers and their excitation profiles:
488 nm blue-green Argon laser (laser light is blue)
543 nm helium-neon green laser (laser light is green)
633 nm helium-neon red laser (laser light is red)
Setting up Lasers
You want the laser wavelength to intersect the fluorophore somewhere on its excitation curve. Otherwise that particular laser will not excite that fluorophore. So if you want to use that laser, you need to buy a different fluorophore. Keep in mind that the laser’s wavelength will not always match your dye’s excitation peak precisely. But this is ok, because lasers are so strong that even if the laser line is not where the excitation peak of the dye is you will still see a result.
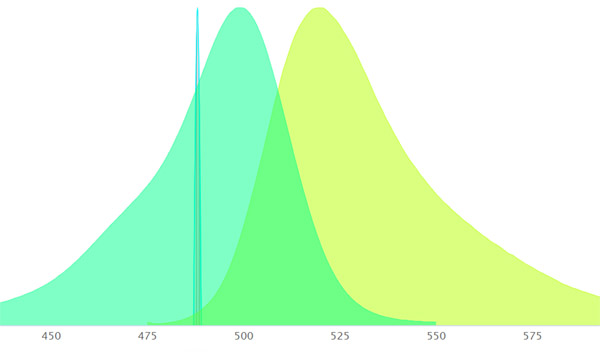
When you graph your laser line on the graph of your fluorophore’s excitation curve (using one of the fluorescence spectra viewers listed below), on the left you should see a “relative intensity” axis in %. This will show you at the point where the laser line intersects the curve how efficient the laser/fluorophore combo will be. The higher the number the better. Note at what color in the spectrum you are.
Be careful when the excitation and emission curves overlap as you want good signal separation.
For emission, you want to be near the peak of the emission curve to obtain the brightest image.
Filters
*Note: Do not worry too much about filters and splitters. Most modern confocal microscopes automatically choose them based on your selections.
Filters transmit certain wavelengths and block others.
You want to choose an excitation filter that allows wavelengths of light your fluorophore can absorb.
You want to use an emission filter that blocks the excitation light while allowing the emission light to pass.
Laser light first hits the excitation filter and passes through, then reflects off a beamsplitter to reach your sample. Fluorophores in the sample absorb the light and emit a different longer wavelength back. This light will pass through the same beamsplitter and then through the emission filter.
For example a 515nm dichroic filter is selected for green fluorescence emission.
Checking staining without confocal
If you have an epifluorescence microscope with filters corresponding to your fluorochrome wavelengths, you can do quick check for staining. This will not give you confocal quality images or 3d stacks, however.
Below is a useful video on fluorophores and filters:
Some Examples To Help You
Let’s look at some examples of fluorophores and how they will appear:
Topro 3 has an excitation max wavelength of 642nm and and emission max wavelength of 661nm. It will appear far red as the emission wavelength is in the far red range. A good laser to use to excite it is the 633 nm helium-neon red laser as its on the excitation curve of Topro 3.
Alexa 555 has an excitation max wavelength of 555nm and an emission max wavelength of 580nm. It will appear red as the emission wavelength is in the red range. A good laser to use to excite it is the 543 nm helium-neon green laser as its on the excitation curve of Alexa 555.
SYTOX Green has an excitation max wavelength of 504nm and and emission max wavelength of 533nm. It will appear green as the emission wavelength is in the green range. A good laser to use to excite it is the 488 nm blue-green Argon laser as its on the excitation curve of Sytox Green.
Alexa 488 has an excitation max wavelength of 490nm and an emission max wavelength of 525nm. It will appear green as the emission wavelength is in the green range. A good laser to use to excite it is the 488 nm blue-green Argon laser as its on the excitation curve of Alexa 488.
Fluorescence Spectra Viewers
Here are some handy website spectra viewer apps to help you plan your confocal experiment.
Simply choose your fluorescent protein or commercial dye to see the excitation and emission peaks for each. You can add more than one to see where there will be overlap. Then add your microscopes existing lasers to see where they will be on the graph. The viewer will tell you what color each laser and dye will be. You can also add filters to see the degree of fluorescence transmission through your filter sets.
If you cannot find your dye of interest, try a different viewer:
https://www.fpbase.org/spectra/
fluorophores.tugraz.at/substance
When you are looking at fluorophores on a company website and that company has a spectra viewer on the site, there will likely be a link on the fluorophore page to open its properties in the spectra viewer, where you can add your laser lines.
Here is a video on how to use a spectra viewer app:
https://searchlight.semrock.com/TutorialVideo.aspx
And here is a really interesting tool that shows you how a cell should stain based on structures you pick and stains you use:
Assigning Pseudo Colors
You can always assign a different color to show in your image acquisition. This is called a pseudo color. Reasons for this might include needing to differentiate between stains that have a similar emission color, where you can change one of the colors to a completely different color. This can be done in the microscope software easily.
Scanning
When you are all set up successfully with your lasers, color channels, pinholes and intensities/gains, you can start scanning. Remember to limit your scanning time as to prevent fading. Because there may be overlap between your color ranges as well as spillover, you may need to use sequential scanning and frame lambda function, which may take longer as light sources and detectors will be completely isolated in their action, but give a better image.
Photobleaching
Be careful with fluorophores. As they are repeatedly hit by bright light they fade. Try to use as little light as possible, keep gain turned down, shorten the exposure time using a lower resolution like 256×256, or use dyes that do not bleach quickly. There are also anti fade compounds available such as those in mounting media.
Click on the following link to learn the difference between confocal and lighsheet.
Recent Posts
Mastering point cloud to 3d model conversion can feel like translating whispers from another dimension into vivid sculptures. You've got this cloud of data points, a chaotic concert of coordinates...
Let's say you've got a drawing, something you sketched out during a burst of inspiration, and now you're itching to see it leap off the page into three dimensions. Well, that’s exactly what I did...